Data cleaning techniques determine whether the analysis reflects reality or quietly amplifies errors hidden in raw data. The blog explains why issues like missing values, duplicates, inconsistent formats, and outliers can distort KPIs, forecasts, and models if they are not handled deliberately. It breaks down core data cleaning techniques, showing what each one fixes, when to use it, and the common mistakes that introduce bias.
Data cleaning is rarely the part people get excited about, but it is the part that decides whether your analysis is trustworthy or misleading.
Dashboards, forecasts, and machine learning models can look convincing, yet still drive the wrong decisions if the data underneath them is flawed. Before analysis adds value, the data has to be consistent, accurate, and fit for purpose. That is where data cleaning techniques matter.
In practice, most datasets arrive with issues built in. Missing values, duplicated records, inconsistent formats, mismatched categories, and outliers that make no business sense are common. Left untreated, these problems quietly distort KPIs, break segmentation logic, and create false confidence in results.
A 2023 Forrester’s Data Culture And Literacy Survey shows that over a quarter of organisations estimate they lose more than $5 million annually due to poor data quality.
This is why data cleaning techniques are not just a technical step, but a safeguard for analysis.
This guide explains what each technique fixes, when to use it, and how to apply it without introducing bias. You will also learn a repeatable data cleaning process, from the first audit to final validation, that keeps data reliable long after the initial cleanup.
What is data cleaning?
Data cleaning is the process of identifying and fixing errors, inconsistencies, and quality issues in raw data so it is accurate, consistent, and ready for analysis. This typically includes removing duplicates, handling missing values, standardising formats, correcting structural errors, and validating that values make sense.
In practical terms, “clean” data means:
-
Values are consistent across the dataset
-
Required fields are populated or handled with a clear policy
-
Formats and data types are standardised
-
Obvious errors and contradictions are removed or flagged
-
The dataset is validated against basic business or analytical rules
Clean does not mean perfect. It means fit for the specific use case.
Why data cleaning matters before analysis
Data cleaning is not a preliminary task you rush through before “real” analysis begins. It directly determines whether your insights reflect reality or noise. No amount of advanced analytics, dashboards, or machine learning can fix data that is incomplete, inconsistent, or fundamentally wrong.
When data is cleaned properly, analysis becomes faster, more reliable, and easier to explain. When it is not, teams often spend more time questioning results than acting on them.
Cleaning data upfront helps:
-
Reduce downstream rework when metrics do not add up
-
Prevent incorrect conclusions from flawed inputs
-
Improve trust in reports and models across stakeholders
What goes wrong when data is messy
Messy data rarely fails loudly. It usually fails quietly, by distorting results in ways that are hard to spot.
Common issues include:
-
Wrong KPIs: duplicated rows inflate revenue, leads, or user counts
-
Broken segmentation: inconsistent category labels split the same group into multiple buckets
-
Unreliable forecasting: missing or incorrect historical values skew trends and seasonality
-
Misleading averages: outliers or invalid values pull metrics in unrealistic directions
These problems often surface late, after dashboards are shared or models are already in use.
Common data quality issues you will fix in this guide
Most real-world datasets contain a predictable set of issues. This guide focuses on fixing the ones that have the biggest impact on analysis quality.
You will learn how to handle:
-
Missing values: blank fields, nulls, or partially populated records
-
Duplicate records: the same customer, transaction, or event captured more than once
-
Inconsistent formats: dates like 01/02/26 and 2026-02-01 in the same column
-
Structural errors: typos, casing differences, or values like “N/A” and “Not Applicable” treated as separate categories
-
Outliers: impossible values or extreme spikes that do not align with business reality
Each issue maps directly to a specific data cleaning technique covered later, with examples and decision guidelines.
Core data cleaning techniques and how to use them
Most data quality issues fall into a small number of repeatable patterns. Data cleaning techniques exist to address these exact problems, but they only work when applied deliberately and consistently.
In this section, we break down the most important data cleaning techniques one by one.
1. Clear and standardise formatting
Inconsistent formatting makes data harder to sort, filter, aggregate, and join. Even when values look similar to the eye, systems often treat them as different. This leads to broken logic in queries, incorrect groupings, and unreliable reporting.
Formatting issues usually appear in:
-
date and time fields
-
currency and numeric values
-
text fields with inconsistent casing or whitespace
-
measurement units recorded in different systems
How to do it
Start by defining a single standard for each field, then convert all values to match that standard.
Common formatting rules include:
-
dates in a single format, such as YYYY-MM-DD
-
consistent time zones for timestamps
-
numeric fields stored as numbers, not text
-
trimmed whitespace at the start or end of text fields
-
consistent casing for categories, such as all lowercase or title case
-
standardised units of measurement, such as converting lbs to kg
Apply these rules across the entire dataset, not just the rows that look problematic.
Common mistakes to avoid
-
Fixing formats visually without changing the underlying data type
-
Standardising only part of the dataset, which creates hidden inconsistencies
-
Ignoring time zones, especially in event or transaction data
-
Mixing formatting cleanup with value corrections in the same step
|
Quick example
Before cleaning, a single date column might contain:
-
01/02/26
-
2026-02-01
-
Feb 1, 2026
After standardisation, all values follow one format:
|
Once standardised, sorting, filtering, and time-based analysis behave as expected.
2. Remove duplicate records
Duplicate records are one of the most damaging data quality issues because they quietly inflate totals and distort analysis. A duplicated customer, transaction, or event often looks valid on its own, which makes the problem easy to miss and hard to trace later.
Duplicates usually appear when data is pulled from multiple systems, ingested repeatedly, or captured without strong uniqueness constraints. They can be exact copies of a row or partial duplicates where key fields match, but other values differ.
What problem this solves
Removing duplicates ensures that each real-world entity is represented once and only once. This prevents:
-
Overstated metrics such as revenue, user counts, or conversions
-
Incorrect cohort analysis and segmentation
-
Misleading trends caused by repeated records
How to do it
Start by defining what “duplicate” means for your dataset. This depends on the context and the available identifiers.
In practice, deduplication often involves:
-
selecting one or more matching fields, such as email, phone number, or customer ID
-
identifying exact duplicates and near-duplicates separately
-
applying a consistent rule to decide which record to keep
When duplicates contain conflicting information, decide upfront how conflicts are resolved. For example, you might keep the most recently updated record, prefer values from a higher-trust source, or merge fields to retain the most complete row.
Common mistakes to avoid
-
Removing duplicates without a clear definition of uniqueness
-
Keeping records arbitrarily when values conflict
-
Deduplicating on unstable fields like names instead of persistent identifiers
-
Applying different deduplication rules to different subsets of the data
|
Practical checklist
Before removing duplicates, confirm:
-
Which fields define uniqueness for this dataset
-
How conflicts between records will be resolved
-
whether records should be merged or dropped entirely
-
How many rows will be affected by the rule
|
Handled carefully, deduplication improves accuracy without sacrificing important information.
3. Handle missing values the right way
Missing values are unavoidable in real-world data. Fields may be left blank, values may not exist at the time of collection, or data may be lost during ingestion. The mistake is not having missing data. The mistake is handling it without a clear policy.
Missing values affect calculations, model behaviour, and even simple filtering. How you treat them should depend on why the data is missing and how important the field is to your analysis.
What problem this solves
Handling missing values correctly prevents:
It also makes assumptions explicit instead of hiding them in the default system behaviour.
How to do it
There is no single “best” way to handle missing values. The right approach depends on context.
Common strategies include:
-
Removing rows or columns when missing values are rare and non-critical
-
Simple imputation using mean, median, or mode for numeric or categorical fields
-
Forward or backward fill for time-series data where values change gradually
-
Using explicit placeholders like “Unknown” when absence is meaningful
In some cases, missingness itself is a signal. For example, a missing churn reason or an empty survey response can carry information worth preserving.
Common mistakes to avoid
-
Filling in values automatically without understanding the cause of missingness
-
Applying the same imputation method to all fields regardless of type or importance
-
Masking systematic data gaps by averaging them away
-
Forgetting to document how missing values were handled
|
Quick example
If less than five percent of a non-critical column is missing, removing those rows may be safe. If a critical field like revenue or event date is missing, imputation or enrichment from another source is usually better than deletion.
Handled deliberately, missing values stop being a liability and become a manageable part of the data cleaning process.
|
4. Standardise data types
Data type issues often sit beneath the surface. A column may look numeric but behave like text, or contain a mix of numbers, strings, and symbols. These problems usually show up later, when calculations fail, or filters behave unpredictably.
Standardising data types ensures that each field behaves the way analysis tools expect it to.
What problem this solves
Incorrect or mixed data types lead to:
-
Failed calculations and aggregations
-
Incorrect sorting, such as “100” appearing before “20.”
-
Joins and filters that silently exclude valid records
Fixing data types early prevents these issues from spreading through downstream analysis.
How to do it
Start by defining the expected type for each column based on its meaning, not how it was ingested.
In practice, this involves:
-
converting numeric fields stored as text into numbers
-
parsing dates and timestamps into proper date formats
-
separating mixed-type columns into clean, single-purpose fields
-
standardising categorical values by mapping synonyms to one label
Once types are standardised, enforce them consistently so new data follows the same rules.
Common mistakes to avoid
-
Forcing type conversions without handling invalid values first
-
Leaving mixed types in place because “most values work.”
-
Treating category cleanup as a one-off instead of a repeatable rule
-
Allowing ingestion pipelines to reintroduce type inconsistencies
|
Practical example
A revenue column containing values like “$1,200”, “1200”, and “1,200 USD” must be cleaned and cast to a numeric type before any aggregation. Without this step, totals and averages will be unreliable or fail.
|
5. Ensure structural consistency across the dataset
Structural inconsistencies make datasets harder to understand, combine, and maintain. They usually appear when data comes from multiple sources or has been handled by different people over time. Even when values are technically correct, an inconsistent structure creates friction and increases the risk of subtle errors.
This technique focuses on making the dataset predictable and coherent as a whole.
What problem this solves
Structural issues often lead to:
-
Confusion about what columns represent
-
Failed joins when merging datasets
-
Duplicated logic caused by slightly different field names or categories
Cleaning structure reduces cognitive load and makes the data easier to reuse.
How to do it
Begin by defining clear conventions, then apply them uniformly.
Key areas to standardise include:
-
Column naming conventions, such as snake_case or camelCase
-
Consistent category labels across all records
-
Aligned schemas when merging datasets from different sources
-
Fixed column order for frequently used tables
When combining data, ensure that fields representing the same concept use the same name, type, and allowed values.
Common mistakes to avoid
-
Allowing near-duplicate columns like “country”, “Country”, and “country_name.”
-
Standardising structure only after analysis begins
-
Ignoring schema drift when new data is added
-
Fixing the structure manually without documenting the rules
|
Practical example
If one dataset uses “US”, another uses “USA”, and a third uses “United States”, these must be mapped to a single standard before aggregation. Otherwise, the same entity appears as multiple categories, fragmenting results.
|
6. Detect and treat outliers
Outliers are values that fall far outside the normal range of a dataset. Sometimes they represent real but rare events. Other times, they are data entry errors, system glitches, or mismatched units. Treating all outliers the same way is a common mistake.
The goal is not to eliminate extremes automatically, but to understand them and decide how they should affect analysis.
What problem this solves
Unmanaged outliers can:
-
skew averages and summary statistics
-
distort visualisations and trends
-
mislead models that assume stable distributions
Handled correctly, outliers either become meaningful signals or are prevented from corrupting results.
How to do it
Start with simple visual checks before moving to statistics. Patterns are often easier to spot than to calculate.
Common approaches include:
-
visual inspection using box plots or scatter plots
-
statistical methods such as interquartile range or z-scores
-
comparing values against known business or physical limits
Once identified, decide on a treatment strategy based on context.
Typical options are:
-
removing values that are clearly invalid
-
capping extreme values at reasonable thresholds
-
transforming values, such as using a log scale
-
keeping the outlier but flagging it for analysis
Flagging outliers is often a practical middle path when you are unsure whether a value is an error.
Common mistakes to avoid
-
Removing outliers without understanding their cause
-
Applying the same thresholds across unrelated fields
-
Hiding outliers through transformation without documenting it
-
Letting extreme values silently influence key metrics
|
Practical example
A daily sales figure that is ten times higher than any other day may be a reporting error or a one-off event like a bulk order. Treating it correctly depends on whether the analysis aims to understand typical performance or rare spikes.
|
7. Validate data accuracy before analysis
Validation is the final checkpoint before analysis begins. Even after cleaning formats, removing duplicates, handling missing values, and managing outliers, data can still contain values that technically pass earlier steps but do not make sense in reality.
Validation focuses on answering a simple question: Does this data align with basic logic, known constraints, and real-world expectations?
What problem this solves
Without validation, datasets may still contain:
-
impossible values that slipped through cleaning rules
-
contradictions between related fields
-
trends that break known business behaviour
Validation reduces the risk of trusting results that are internally inconsistent or logically flawed.
How to do it
Start with sanity checks based on rules and expectations you already know.
Common validation checks include:
-
range checks, such as percentages between 0 and 100
-
logical rules, like end dates occurring after start dates
-
cross-field consistency, such as discounts not exceeding the total price
-
trend checks, for example, revenue not going negative unless refunds exist
Beyond rules, sampling is critical. Spot-checking records against source systems or trusted references often catches issues that automated checks miss.
Common mistakes to avoid
-
Assuming earlier cleaning steps guarantee accuracy
-
Validating only individual fields and not relationships between them
-
Skipping manual spot checks entirely
-
Failing to record which validation rules were applied
|
Practical example
If a dataset shows negative order values but refunds are not part of the system, this is not a formatting issue. It is a validation failure that needs investigation before analysis continues.
|
The data cleaning process step by step
Individual data cleaning techniques are useful, but real datasets rarely have just one problem. They usually have several, layered on top of each other. That is why data cleaning works best as a structured process rather than a series of ad hoc fixes.
This section lays out a practical data cleaning process you can follow from start to finish. Each step builds on the previous one and helps you decide whether to remove, correct, keep, or flag data based on its impact.
By the end of this process, the dataset should be consistent, validated, and ready for analysis, with assumptions clearly documented.
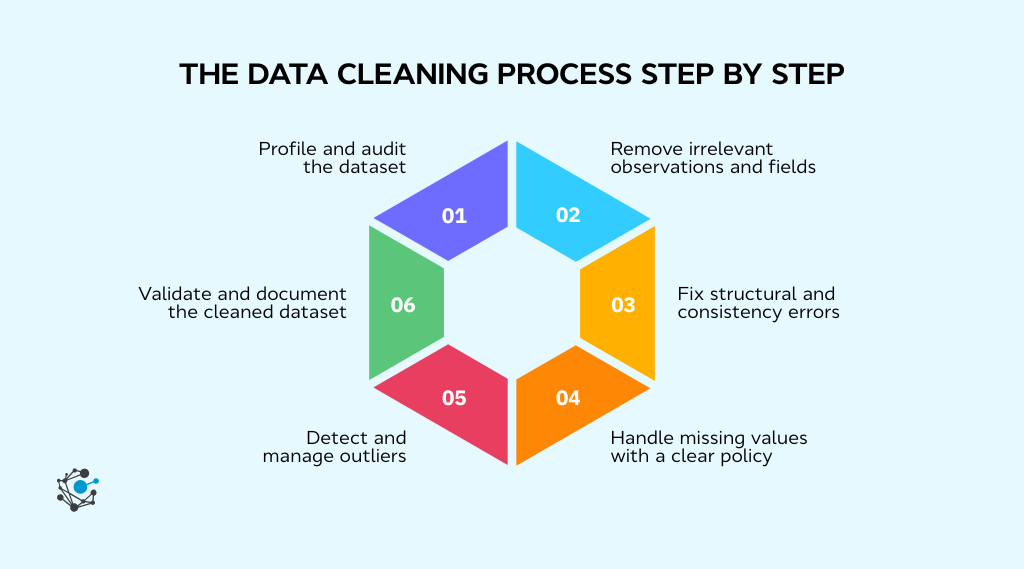
Step 1: Profile and audit the dataset
Before changing anything, you need to understand what you are working with. Profiling gives you a high-level view of data quality issues and helps you prioritise what actually needs fixing.
Start by reviewing:
-
column names, data types, and expected ranges
-
percentage of missing values per column
-
number of duplicate rows
-
unique values and spelling variations in categorical fields
This initial audit often reveals patterns, such as entire columns with systematic gaps or categories that should be merged.
Profiling first saves time later. It prevents you from fixing symptoms while missing the root cause.
Step 2: Remove irrelevant observations and fields
Not every column or row belongs in the analysis. Some data is collected for tracking, debugging, or operational purposes and adds no analytical value.
At this stage, remove:
-
columns that are not used for the analysis goal, such as internal IDs or unused metadata
-
rows outside the scope of analysis, like test records or incorrect geographies
Be deliberate here. Avoid deleting data blindly. Always document what was removed and why, so decisions are traceable and reversible.
Step 3: Fix structural and consistency errors
Once the dataset is scoped correctly, focus on structure and consistency. This is where many hidden issues surface.
Typical fixes include:
-
standardising column names and category labels
-
correcting casing, whitespace, and common typos
-
normalising units and formats across sources
This step ensures that similar values are treated as the same entity throughout the dataset, which is critical for grouping and aggregation.
Step 4: Handle missing values with a clear policy
Once structure and consistency are in place, missing values become easier to assess. At this point, you should decide how each missing field will be handled, based on its importance and the reason it is missing.
There is no universal rule, but every decision should be intentional and documented.
In practice, this step involves:
-
deciding whether rows or columns with missing values can be safely removed
-
choosing an imputation method when values are required for analysis
-
identifying cases where missingness itself should be preserved as a signal
A simple decision framework helps avoid overcorrection.
As a rule of thumb:
-
If less than five percent of a non-critical field is missing, removing those rows is often acceptable
-
If a critical field is missing, imputation or enrichment is usually better than deletion
-
If missingness is systematic, treat it as meaningful rather than noise
Document assumptions clearly, especially when imputing values, since these choices can influence results.
Step 5: Detect and manage outliers
With missing values handled, you can focus on extreme values that may still distort the analysis. Outliers should be reviewed in context, not removed automatically.
Start by checking:
-
visual distributions using simple plots
-
values against known business or physical limits
-
sudden spikes or drops that break historical patterns
Once identified, decide whether each outlier is an error, a rare but valid event, or something that should be flagged rather than changed. The goal is to control impact without erasing meaningful behaviour.
Step 6: Validate and document the cleaned dataset
The final step is to confirm that cleaning achieved its goal. Re-run profiling checks to verify that issues have been resolved and no new ones have been introduced.
This step should include:
-
validating ranges, allowed values, and cross-field rules
-
confirming row counts and totals against expectations
-
logging what was changed, removed, or imputed, and why
Documentation is not optional. It ensures the dataset can be trusted, reproduced, and explained to others.
Data cleaning methods by data type and use case
Not all data needs to be cleaned in the same way. The techniques you apply should change based on how the data is structured and how it will be used. A dataset prepared for BI reporting has different requirements than one used for machine learning or event-level analysis.
Cleaning structured data
Structured data is the most common starting point for analysis. It usually lives in tables, spreadsheets, or SQL extracts with clearly defined rows and columns.
Cleaning structured data focuses on enforcing rules and consistency at scale. This often includes:
-
validating schemas and data types
-
enforcing primary keys and uniqueness constraints
-
checking referential integrity across related tables
-
standardising categorical values used for grouping and filtering
Because structured data is predictable, many cleaning steps can be automated once rules are defined. The key is to align those rules with the reporting or analysis requirements, not just database constraints.
Cleaning semi-structured data
Semi-structured data includes JSON files, API responses, logs, and event streams. While it follows a loose structure, fields may appear or disappear over time, and nesting can vary across records.
Cleaning this type of data often involves:
-
handling missing or optional keys gracefully
-
managing schema drift as new fields are introduced
-
flattening nested structures into analysable tables
-
standardising event names and attributes
Here, cleaning and transformation are closely linked. The goal is to bring semi-structured data into a consistent shape without losing important context.
Data preprocessing for machine learning
Machine learning adds additional constraints to data cleaning. Decisions made during cleaning directly affect model performance and generalisability.
Key considerations include:
-
handling missing values differently for numeric, categorical, and text features
-
ensuring encoding and scaling are applied consistently
-
avoiding data leakage by learning cleaning rules only from training data
-
applying the same cleaning logic to both training and inference pipelines
For machine learning, “clean” data means not only error-free but also prepared in a way that supports fair evaluation and stable predictions.
Data validation and quality checks you should run every time
Data cleaning improves quality at a point in time. Data validation is what keeps that quality from eroding. As datasets grow, refresh, or pull from new sources, even well-cleaned data can drift back into an unreliable state if checks are not enforced.
Validation turns data quality from a manual, reactive task into a repeatable safeguard. It helps teams catch errors early, understand when assumptions break, and prevent flawed data from reaching decision-makers.
At a minimum, every dataset used for reporting, analysis, or modelling should pass a standard set of validation checks before it is considered usable.
Rule-based validation checks
Rule-based checks verify that data complies with explicit, predefined conditions. These rules are usually derived from business logic, data definitions, or analytical requirements.
Common rule-based checks include:
-
Required fields must not be null or empty
-
Numeric values must fall within realistic ranges
-
Categorical fields must match an approved list of values
-
Date logic must hold, such as end dates occurring after start dates
-
Cross-field consistency, such as discounts not exceeding the order value
These checks are effective because they are deterministic. A record either passes or fails. When a rule fails, the issue is clear and actionable.
Rule-based checks should be documented alongside the dataset so stakeholders understand what “valid” means in practice.
Statistical validation checks
Not all data issues break explicit rules. Some only become visible when you look at distributions, trends, or changes over time. This is where statistical validation adds value.
Statistical checks focus on identifying unexpected behaviour, such as:
-
sudden spikes or drops in key metrics
-
shifts in category proportions that do not align with business changes
-
abnormal increases in missing values or duplicate rates
-
changes in distribution shape, such as increased skew or variance
These checks are especially useful for recurring datasets, where historical patterns provide a baseline. They help surface issues caused by upstream changes, pipeline failures, or new data sources.
Statistical validation does not prove correctness, but it highlights where closer investigation is needed.
Automating data validation in pipelines
For recurring workflows, validation should not rely on manual review. Automated validation ensures that the same standards are applied every time data is refreshed.
In practice, automation involves:
-
running validation checks at ingestion, transformation, and before reporting or modelling
-
setting thresholds that trigger alerts when exceeded, rather than stopping pipelines for minor issues
-
logging validation results to track data quality trends over time
Automation also supports accountability. When a validation rule fails, teams know where the issue occurred and can address it at the source.
Over time, automated validation reduces firefighting and makes data cleaning a proactive, ongoing process instead of a one-off exercise.
|
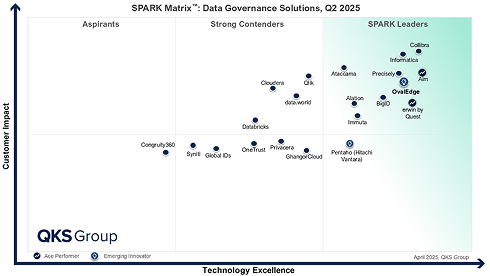
Pro tip: Automating data validation works best when ownership, lineage, and quality rules are visible in one place. Platforms like OvalEdge help teams centralise this context so issues are caught early and accountability is clear.
|
Best data cleaning practices for reliable results
Reliable analysis starts long before models or dashboards. It begins with how you clean your data. A few disciplined practices can make the difference between insights you trust and numbers you keep second-guessing.
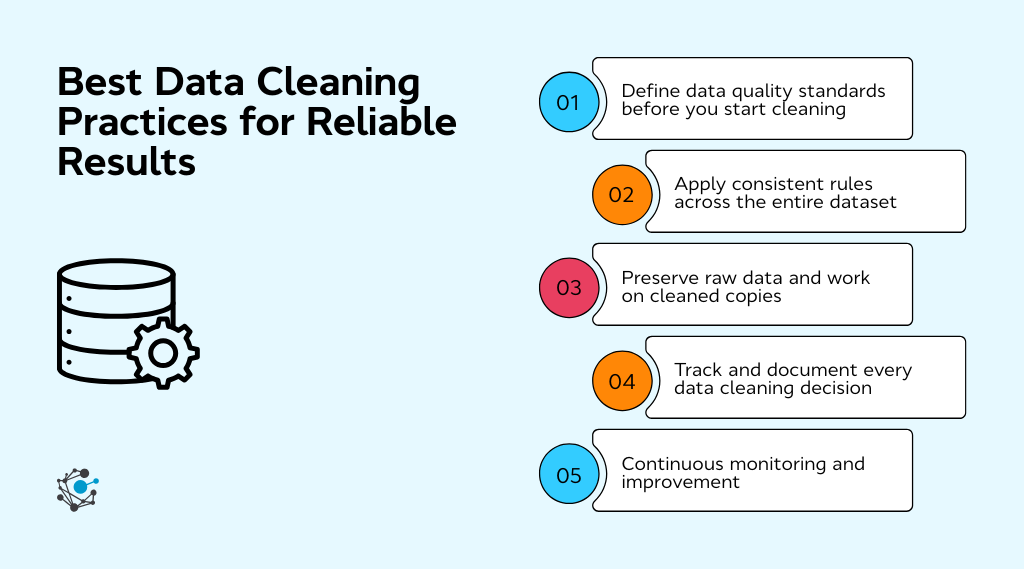
Define data quality standards before you start cleaning
Before touching the dataset, be clear on what “good data” means for your use case. Decide acceptable ranges, formats, completeness thresholds, and error tolerances. When standards are defined upfront, cleaning becomes a structured process rather than a series of subjective fixes.
Apply consistent rules across the entire dataset
Inconsistency is one of the fastest ways to introduce bias. If you decide how to handle missing values, duplicates, or outliers, apply the same logic everywhere. This ensures comparability across records, time periods, and segments, which is critical for reliable analysis.
Preserve raw data and work on cleaned copies
Always keep an untouched version of the original dataset. Working on copies protects you from irreversible mistakes and allows you to revisit assumptions later. It also makes audits, reprocessing, and alternative cleaning approaches much easier.
Track and document every data cleaning decision
Cleaning choices shape outcomes. Document what was removed, corrected, imputed, or flagged, along with the reasoning behind each decision. This makes analyses easier to explain, reproduce, and challenge, especially when results are used for high-stakes decisions.
Continuously monitor data quality after cleaning
Data quality degrades over time as sources, systems, and behaviour change. Ongoing validation checks help catch issues early, prevent regressions, and ensure that cleaned data stays reliable long after the initial cleanup.
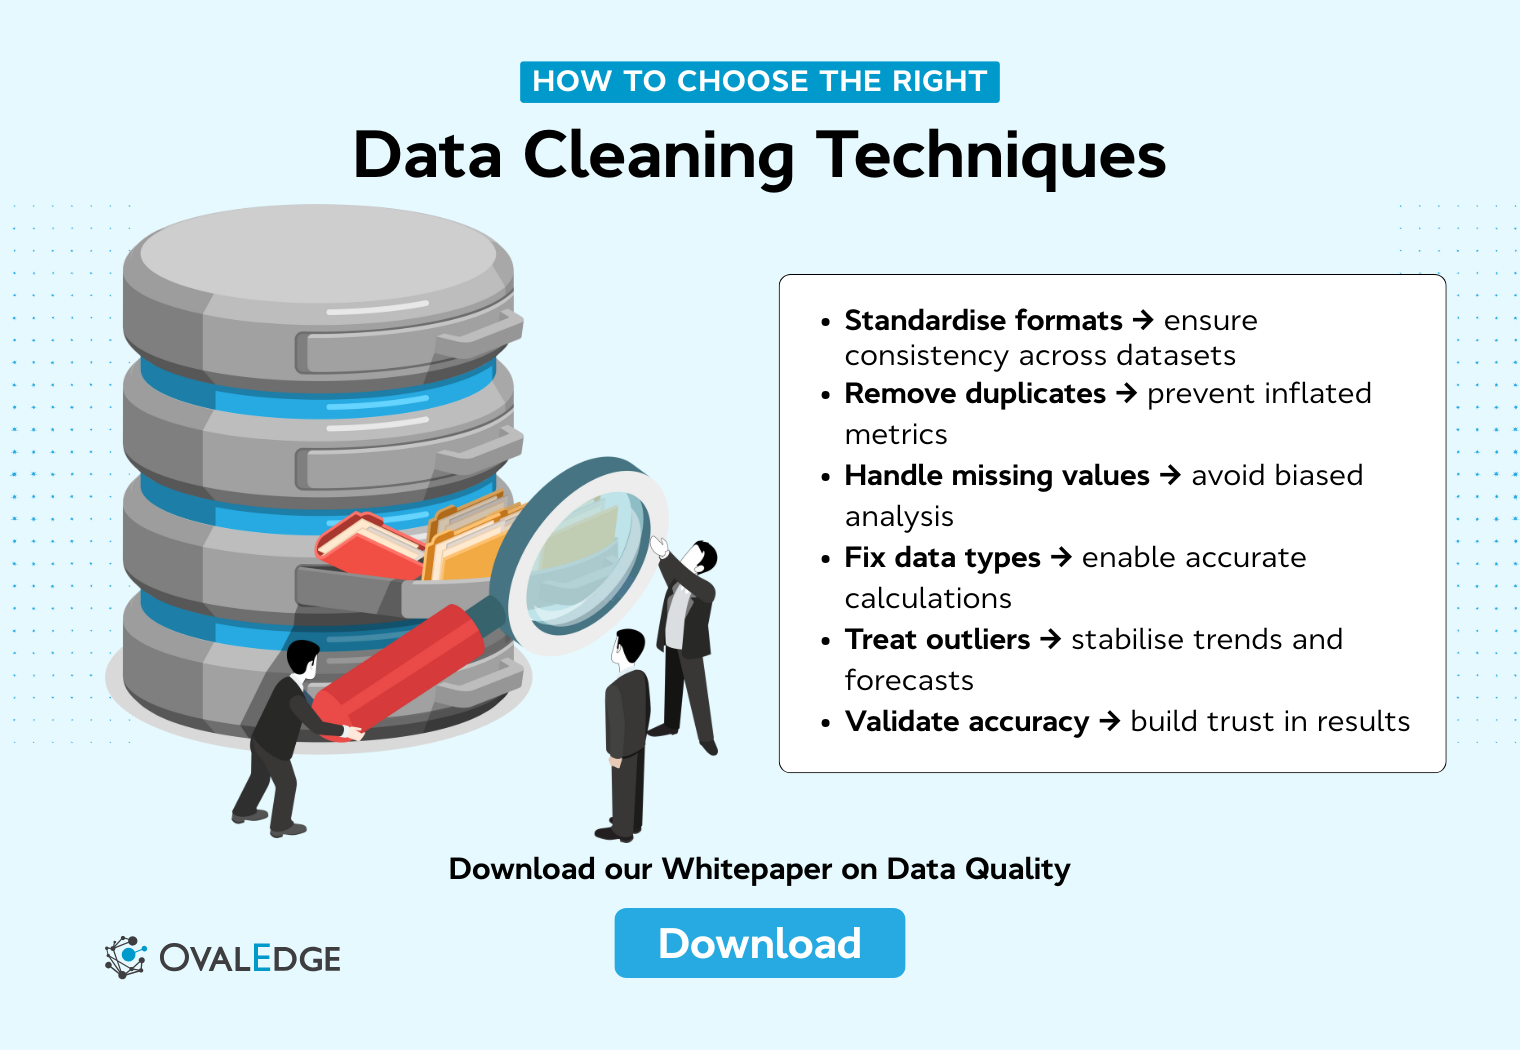
How to choose the right data cleaning approach
There is no single data cleaning approach that works for every dataset. The right choices depend on what the data will be used for, how it is structured, and which quality issues actually affect outcomes. Cleaning without this context often leads to unnecessary data loss or hidden bias.
1. Understand the goal of your analysis first
Start by clarifying what decisions, reports, or models the data will support. The same dataset may need different cleaning rules depending on the use case.
Ask yourself:
-
Which metrics or outputs will be used to make decisions
-
Which fields directly affect those outputs
-
What level of accuracy and completeness is required
Fields that influence key decisions should be treated more carefully than those used only for reference.
2. Assess the type, size, and structure of your data
The scale and structure of the data determine how much automation and rigour is needed.
Consider:
-
Whether the data is structured, semi-structured, or unstructured
-
If it is a one-time extract or continuously updated
-
Whether the dataset is small enough for manual review or requires automated checks
Larger and recurring datasets benefit more from scripted and validated workflows.
3. Identify the nature and impact of data quality issues
Not all issues have the same consequences. Focus first on problems that change analytical outcomes.
Evaluate:
-
Whether errors materially affect metrics or segmentation
-
If missing values break calculations or can be tolerated
-
Whether outliers represent real events or data entry mistakes
This helps prioritise fixes that matter.
4. Decide whether to remove, correct, impute, or flag data
Every data issue requires a choice. Making that choice explicit reduces bias and inconsistency.
In general:
-
Removing data when guessing would be riskier than losing records
-
Correct values when reliable rules or reference data exist
-
Impute only when it adds analytical value, and assumptions are acceptable
-
Flag values when you want to preserve information without letting it distort results
Document these decisions for later review.
5. Balance accuracy, speed, and scalability
There is always a trade-off between how clean the data is, how fast it is delivered, and how easy the process is to maintain.
Think about:
-
Whether manual cleaning is sustainable as data grows
-
How much delay is acceptable before insights are needed
-
Whether workflows can be reused across datasets
Repeatable, well-documented processes usually outperform one-off perfection.
6. Choose tools and workflows that match your context
The right tools depend on scale and risk.
For example:
-
Spreadsheets work for small, low-risk datasets
-
SQL and scripts support repeatable, auditable cleaning
-
Validation rules and pipelines suit production analytics
Match the tool to the problem, not the other way around.
7. Validate decisions and document assumptions
After cleaning, re-check the data against your original goals. Ensure that cleaning choices did not remove important signals or introduce unintended bias.
Always record:
-
Applied rules and thresholds
-
Known limitations of the cleaned data
-
Signals that indicate the dataset may need re-cleaning
A reusable checklist helps teams apply consistent standards across projects.
Conclusion
Data cleaning techniques are not about making data look neat. They are about making data reliable enough to support real decisions. From standardising formats and removing duplicates to handling missing values, managing outliers, and validating accuracy, each technique helps reduce risk and improve trust in analysis.
Teams that do this well treat data cleaning as an ongoing process, not a one-time task. They define quality standards upfront, apply consistent rules, preserve raw data, and document decisions so assumptions remain clear as data evolves.
As data environments grow more complex, manual checks stop scaling. Effective validation depends on visibility into data ownership, lineage, and quality rules across systems.
Platforms like OvalEdge help centralise this context, making it easier to catch issues early, assign accountability, and stop low-quality data from reaching analytics or AI workflows.
Clean data is not an end state. It is a capability that needs to be maintained as systems, use cases, and data volumes change.
FAQs
1. How do you know when data is clean enough to use?
Data is clean enough when it meets the accuracy, consistency, and completeness required for the specific analysis goal. This usually means critical fields are validated, error rates fall within agreed thresholds, and known limitations are documented. Clean enough is contextual, not absolute.
2. What is the difference between data cleaning and data wrangling?
Data cleaning focuses on fixing errors, inconsistencies, and quality issues in raw data. Data wrangling includes cleaning but also covers transforming, reshaping, and combining datasets to make them usable for analysis or modelling. Cleaning improves correctness, while wrangling improves usability.
3. Should data cleaning be done manually or automatically?
Manual data cleaning works well for small, one-off datasets or early exploratory analysis. Automated cleaning is better for recurring workflows, large datasets, or production pipelines where consistency and repeatability matter. Most teams use a mix of both based on scale and risk.
4. How often should data cleaning be performed?
Data cleaning should be continuous rather than a one-time task. For live data systems, cleaning and validation checks should run during ingestion or transformation. For static datasets, cleaning should be repeated whenever new data is added or sources change.
5. Can data cleaning introduce bias into analysis?
Yes. Bias can be introduced if rows are removed selectively, missing values are imputed without context, or outliers are discarded without understanding their cause. To reduce bias, cleaning decisions should be documented and aligned with the analysis objective.
6. What is the biggest mistake teams make when cleaning data?
The most common mistake is cleaning data without a clear use case in mind. This often leads to over-cleaning, unnecessary data loss, or inconsistent rules. Effective data cleaning starts by defining how the data will be used and what level of accuracy is required.


3ff1.png)
aef2.png)