

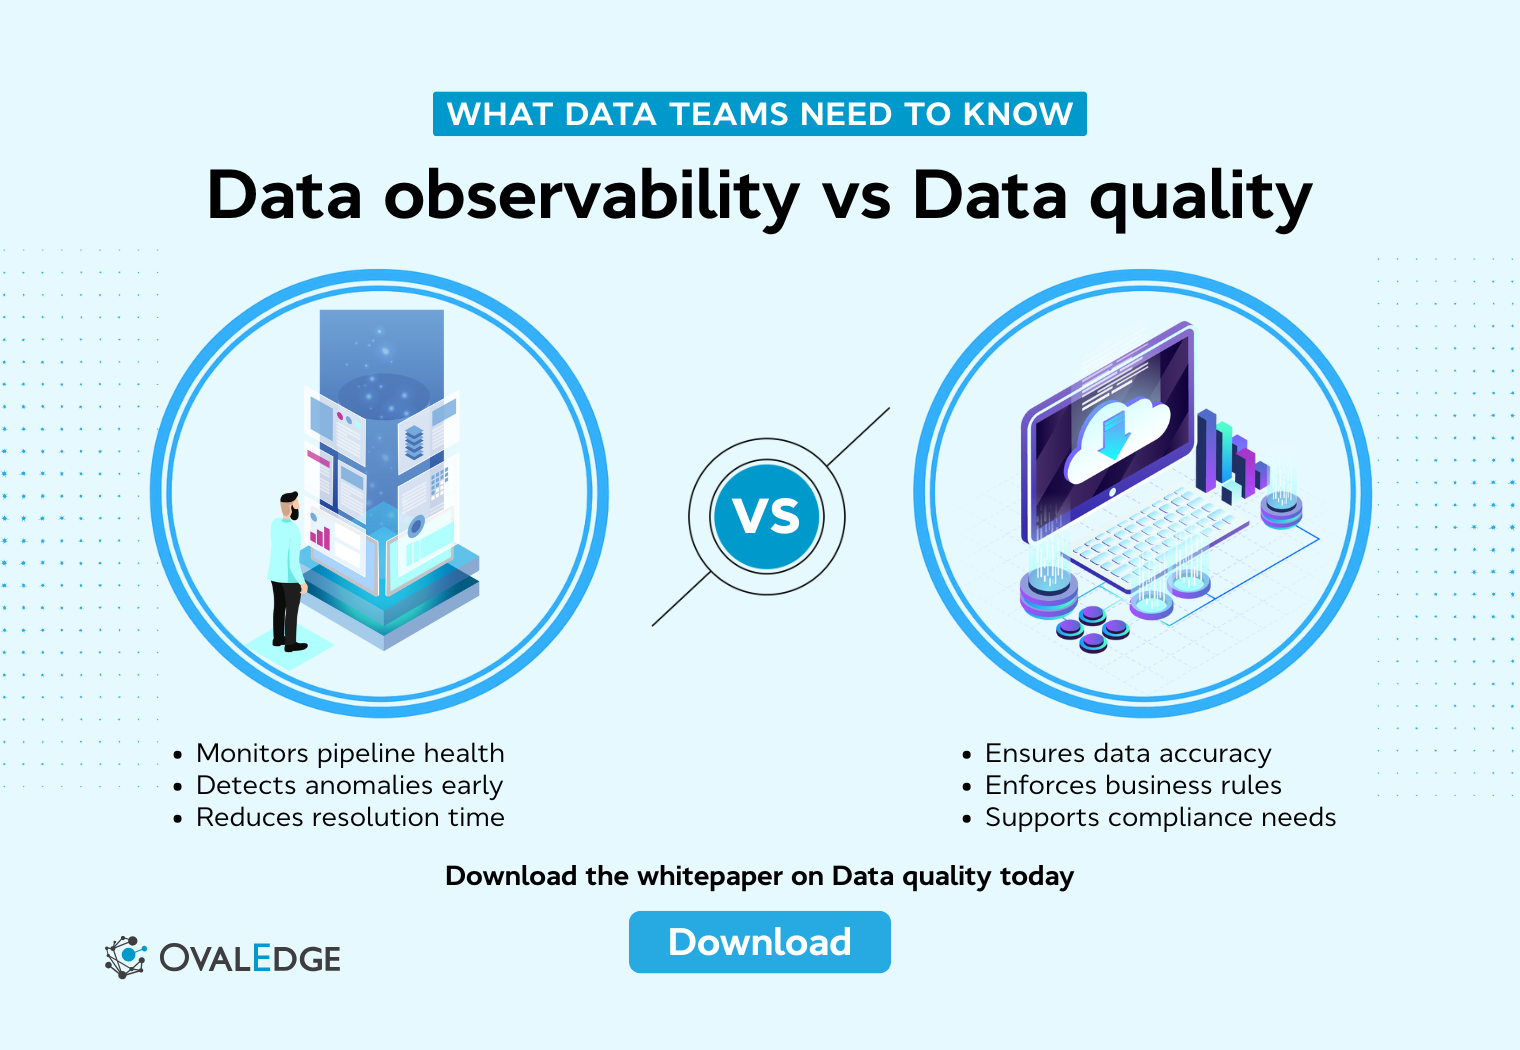
Trust in analytics often breaks down as data systems become more complex, real-time, and interconnected. This blog explains the difference between data observability and data quality, clarifying how each addresses a distinct reliability risk. Data quality focuses on correctness and compliance through rule-based validation, while data observability monitors system behavior to detect unexpected failures early. Used together, they reduce downtime, shorten investigation time, and improve confidence in analytics. The article also shows how modern data teams evolve from reactive checks to proactive data trust, with practical guidance on when to use each approach and how OvalEdge supports this journey.
Trust in data rarely breaks all at once. It fades slowly. A metric looks slightly off. A dashboard refresh raises questions instead of confidence. Over time, teams stop asking what the data says and start asking whether it can be believed.
As data ecosystems become more cloud-native, real-time, and automated, these moments of doubt are becoming routine rather than rare.
What is changing is how seriously organizations are taking this problem.
The global data observability market is projected to reach 1.7 billion USD in 2025 and grow to 9.7 billion USD by 2034, with a CAGR of 21.3 percent, driven by the adoption of data reliability tools, real-time monitoring, and AI-powered observability across modern data platforms, as per the 2025 Dimension Market Research report.
That growth signals a clear shift. Teams are no longer relying on manual checks and ad hoc validation to keep analytics trustworthy.
At the same time, confusion around data observability vs data quality continues to slow progress. These concepts are often treated as interchangeable, even though they address very different risks.
This article helps us clarify the difference, understand how they work together, and decide when to use each approach to build analytics we can trust at scale.
What is data quality?
Data quality is about whether data is correct, complete, consistent, and fit for its intended business use. When teams talk about trusting numbers in reports or meeting regulatory requirements, they are usually referring to data quality. At its core, it answers a simple question. Can we rely on this data to make a decision?
In practice, data quality is enforced through structured validation at the dataset, table, and field levels. This includes ensuring required fields are populated, values follow defined rules, and data aligns with shared business definitions.
|
Pro Tip: For a practical, strategic guide on building and sustaining effective data quality practices, check out OvalEdge’s data quality whitepaper. It lays out a clear framework for tying quality rules to govern metadata and embedding quality into your data governance processes. |
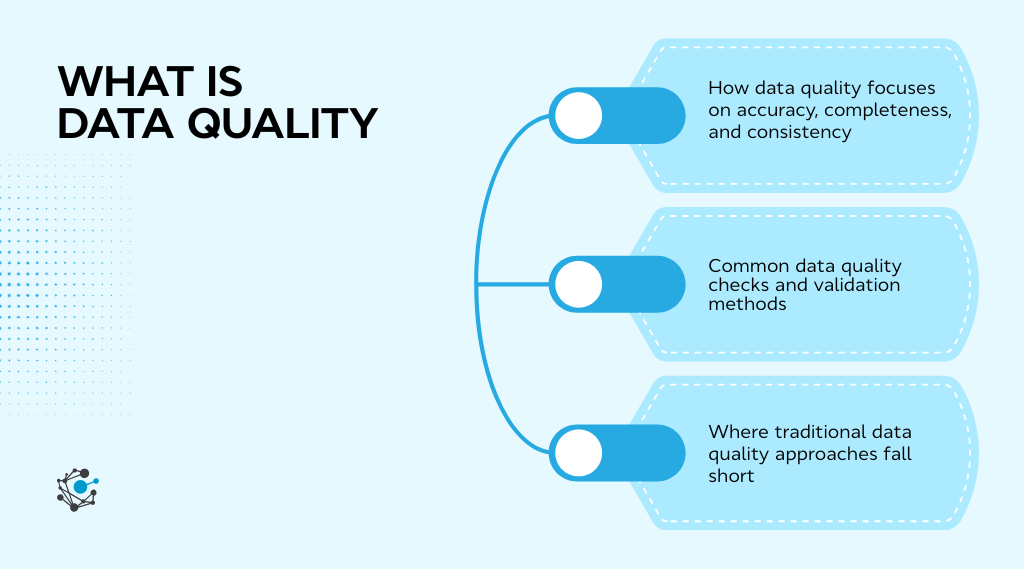
How data quality focuses on accuracy, completeness, and consistency
Data quality is typically defined through a set of dimensions that describe what “good” data looks like. These dimensions help teams translate abstract trust issues into measurable checks that can be enforced across systems and pipelines.
Common data quality dimensions include:
-
Accuracy, which confirms that values correctly represent real-world entities or events
-
Completeness, which checks whether the required data is present
-
Consistency, which ensures that the same data does not conflict across systems
-
Validity, which verifies formats, ranges, and allowed values
-
Timeliness, which ensures data arrives when it is expected
These dimensions rely on predefined expectations. Teams decide in advance what correct data looks like and then validate incoming data against those rules at scale.
For a deeper, forward-looking perspective on how these dimensions are evolving and how organizations should prioritize them, readers can explore the blog Data Quality Dimensions: Key Metrics & Best Practices for 2026, which expands on practical metrics, ownership models, and modern enforcement strategies aligned with today’s data ecosystems.
Common data quality checks and validation methods
Most data quality programs are built on deterministic, rule-based checks. These checks are explicit and predictable, which makes them easy to understand and audit.
Typical data quality validations include:
-
Null or missing value checks on critical fields
-
Range checks to catch out-of-bounds values
-
Format validation for dates, emails, or identifiers
-
Referential integrity checks across related tables
These checks are often executed on scheduled batches or static datasets. They work well when data structures are stable, and business rules change infrequently.
Where traditional data quality approaches fall short
Rule-based data quality struggles as data systems become more dynamic. Schemas evolve, volumes fluctuate, and new data sources are introduced faster than rules can be updated. When checks only look for known failure conditions, unexpected issues often slip through unnoticed.
Another limitation is timing. Many data quality problems are discovered only after the data reaches dashboards or reports. By then, the impact has already spread. This is why data quality alone often leads to reactive firefighting rather than early detection, especially in complex, fast-moving data environments.
What is data observability?
As data systems become more complex, checking individual datasets is no longer enough to understand whether the system is healthy. Data observability focuses on a different question altogether. Instead of asking whether data meets a specific rule, it asks whether the entire data system is behaving as expected as data flows through it.
Data observability is about continuously understanding the health of data pipelines by observing their outputs, patterns, and metadata. It helps teams detect issues early, often before dashboards break or business users notice inconsistencies.
This makes observability especially valuable in modern environments where data is constantly changing, and dependencies are hard to track manually.
How data observability monitors data systems end-to-end
Data observability looks across the full lifecycle of data, from ingestion to consumption. It does not stop at a single table or transformation. Instead, it spans sources, pipelines, orchestration layers, warehouses, and downstream analytics tools.
By monitoring data as it moves through these layers, observability provides system-level visibility. When something changes unexpectedly, such as a sudden drop in volume or a delay in freshness, teams can see where the issue surfaced and how far it propagated. This end-to-end perspective is what allows observability to catch failures that traditional checks often miss.
The five pillars of data observability explained simply
Data observability relies on a small set of signals to understand whether data systems are behaving as expected.
Each pillar highlights a different type of failure, helping teams detect issues early and understand impact without defining every possible rule in advance.
|
Pillar |
What it tracks |
What it helps detect |
|
Freshness |
Whether data arrives on time |
Detects delayed or stalled pipelines before reports break |
|
Volume |
Sudden spikes or drops in record counts |
Surfaces missing data, duplicates, or upstream ingestion issues |
|
Distribution |
Shifts in data values over time |
Identifies subtle changes that affect analytical accuracy |
|
Schema |
Structural changes in datasets |
Catches breaking changes like added, removed, or renamed fields |
|
Lineage |
How data flows across systems |
Shows where issues originate and how far they propagate |
Together, these pillars provide system-level visibility. Instead of validating individual records, they focus on patterns and behavior, which is what allows observability to scale in modern, fast-changing data environments.
How observability detects unknown data failures early
Traditional data checks focus on known risks. Observability is designed to surface unknown ones. By learning what normal looks like over time, observability tools can flag anomalies that teams did not explicitly anticipate.
This approach is especially powerful in fast-changing pipelines where new data sources, transformations, and consumers are added frequently. Instead of waiting for users to report broken dashboards, observability helps teams detect issues early, reduce investigation time, and limit the downstream impact before trust is lost.
|
Related reading: Data Observability Tools: What Modern Data Teams Should Know |
How data observability and data quality work together
Data observability and data quality are often framed as competing approaches, but that view oversimplifies the real challenge enterprises face. Reliable data operations require both correctness and stability, and these disciplines address different failure modes.
Data quality focuses on whether data meets defined business rules and standards. Data observability focuses on whether the systems producing that data are behaving normally over time. Treating one as a replacement for the other creates blind spots. Teams either rely on rigid rules that miss unexpected failures or broad monitoring that lacks business context. Used together, they create a stronger foundation for trusted analytics, reporting, and automation.
Data correctness versus system reliability
Data quality and data observability solve different parts of the same problem. One ensures that data is correct. The other ensures that data systems are healthy and predictable.
Data quality determines whether individual records and datasets comply with business logic, regulatory requirements, and defined standards. Observability looks at patterns, trends, and behavior across pipelines to identify unusual changes that signal potential failure.
In practice, this division of responsibility is clear:
-
Data quality validates correctness, confirming that values meet business and compliance rules
-
Data observability monitors behavior, tracking freshness, volume, schema, and distribution trends
-
Quality answers “Is this data usable?”, while observability answers “Is this system behaving normally?”
Why observability cannot replace data quality controls
Observability is powerful, but it does not validate business meaning at the record level. It cannot confirm whether a revenue number complies with accounting rules or whether a customer attribute meets regulatory standards. Those checks require explicit data quality rules that encode business logic.
Data quality remains essential wherever precision, auditability, and deterministic validation matter. Financial reporting, regulatory submissions, and master data management depend on knowing that specific rules are enforced consistently and can be explained after the fact. Observability complements this by ensuring the pipelines delivering that data remain stable and transparent.
The boundaries are important to understand:
-
Observability detects abnormal behavior, not business correctness
-
Quality rules enforce policy and compliance, not system health
-
Replacing one with the other creates gaps, either in coverage or context
How observability amplifies data quality efforts
Observability becomes most valuable when it is used to focus and strengthen data quality efforts rather than replace them. It helps teams apply quality controls where they matter most and earlier in the data lifecycle.
Rather than spreading quality checks evenly across all data assets, observability introduces prioritization and timing into the process. It turns data quality from a broad compliance exercise into a targeted reliability practice.
Step 1: Identify high-impact data assets
Observability highlights which datasets and pipelines drive critical reports, models, and operational processes. This allows teams to concentrate data quality rules on assets where failures would have the greatest business impact instead of applying exhaustive checks everywhere.
Step 2: Detect issues earlier in the pipeline
Signals such as freshness delays, volume anomalies, or distribution shifts often appear before incorrect data reaches dashboards or downstream systems. Observability surfaces these signals upstream, giving teams time to intervene before trust is compromised.
Step 3: Reduce noise and operational rework
By focusing on meaningful deviations rather than every minor change, observability reduces alert fatigue. This shifts data quality from reactive cleanup after incidents to proactive prevention before issues escalate.
In practice, this step-based interaction leads to:
-
Focused quality coverage, targeting high-impact datasets rather than the entire estate
-
Earlier issue detection, stopping problems before they affect downstream consumers
-
Lower operational overhead, minimizing repeated fixes and unnecessary alerts
Metadata-driven monitoring versus record-level validation
One of the most important practical differences between observability and traditional data quality checks is how they scale. Observability relies on metadata, statistics, and behavioral signals rather than scanning entire datasets, enabling continuous monitoring with minimal performance or cost overhead.
Traditional data quality checks still play a critical role, especially where business correctness and compliance are required. However, these checks often depend on full table scans, which become expensive and slow when applied broadly across large data estates.
The contrast is clearer in practice:
-
Metadata-driven monitoring focuses on behavior, using signals such as freshness, volume, schema changes, and distribution trends
-
Record-level validation enforces correctness, checking individual records against defined business and regulatory rules
-
Observability scales efficiently, since it operates on metadata rather than full datasets
-
Quality checks are precise but costly, especially when run indiscriminately
A metadata-driven approach, supported by platforms such as OvalEdge, helps teams connect observability signals with lineage and governed context. This makes it easier to understand where issues originate, which downstream assets are affected, and which quality checks truly matter in production environments.
When metadata, lineage, and governance are combined, teams can:
-
Trace issues to their source, instead of reacting at the dashboard level
-
Assess downstream impact quickly, across reports, models, and consumers
-
Prioritize the right checks, reducing unnecessary scans and operational overhead
This balance allows enterprises to maintain high data reliability while keeping observability and data quality scalable, explainable, and sustainable in production.
When to use data quality, data observability, or both
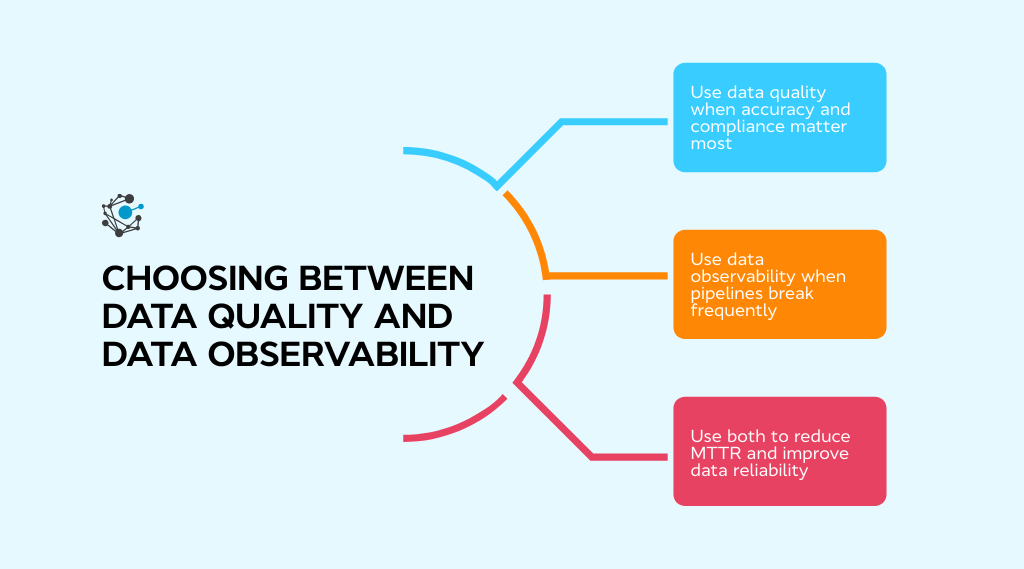
The choice between data quality and data observability depends on the type of failure a team is trying to prevent. Some risks come from incorrect values that violate business rules. Others come from unstable or opaque pipelines where failures are difficult to predict. Understanding this distinction helps teams apply the right approach without adding unnecessary complexity.
Use data quality when accuracy and compliance matter most
Data quality is the right focus when the cost of incorrect data is high and validation rules are clearly defined. Scenarios such as financial reporting, regulatory submissions, and master data management depend on deterministic checks that guarantee correctness. In these environments, teams need confidence that required fields are populated, values fall within approved ranges, and definitions are applied consistently.
These use cases tend to be relatively stable. Schemas evolve slowly, business logic changes infrequently, and deviations must be caught explicitly. Data quality provides the auditability and repeatability needed for governance, compliance, and executive reporting.
Data quality is most effective when:
-
Accuracy is non-negotiable, and incorrect values carry financial or regulatory risk
-
Rules are well-defined, stable, and agreed upon by the business
-
Auditability is required, with clear explanations of how the data was validated
-
Schemas change infrequently, reducing uncertainty in validation logic
Use data observability when pipelines are dynamic, and failures are unpredictable
Data observability becomes more effective when pipelines change frequently and issues are difficult to anticipate. Modern data stacks ingest from many sources, apply layered transformations, and serve diverse downstream consumers. In this context, failures often appear as delays, volume shifts, or unusual patterns rather than clear rule violations.
Observability focuses on system behavior rather than record-level correctness. By monitoring trends in freshness, volume, schema, and distribution, teams can detect problems early and understand the impact before stakeholders lose confidence in the data.
Data observability is most useful when:
-
Pipelines evolve frequently, with changing sources and transformations
-
Failures are unpredictable, and rules cannot cover every scenario
-
Early warning matters, before incorrect data reaches consumers
-
System transparency is limited, making root-cause analysis difficult
Use both to reduce MTTR and improve data reliability
Most mature data organizations benefit from using both approaches together. Observability surfaces that something is wrong as quickly as possible. Data quality explains what is wrong and whether it violates business expectations. Together, they shorten investigation time and limit the spread of bad data.
This layered approach turns reliability into a system property rather than a collection of isolated checks. Over time, it allows analytics teams to move faster, respond to issues with confidence, and scale without sacrificing trust.
Using both approaches together enables teams to:
-
Detect issues faster, reducing mean time to detection
-
Diagnose root causes more accurately, using quality rules and context
-
Limit downstream impact, preventing incorrect data from spreading
Real-world impact of poor data quality and low observability
When data quality and observability are weak, the consequences show up far beyond the data team. What starts as a silent issue in a pipeline often turns into missed decisions, rework, and growing skepticism toward analytics. Over time, this erosion of trust becomes a business problem, not just a technical one.
Cost of bad data and system failures
Poor data quality creates direct and compounding costs across the organization. Teams spend time reprocessing data, reconciling reports, and responding to questions that should never have surfaced in the first place. The business impact is equally significant.
A 2023 McKinsey article reports that about 60% of technology executives view poor data quality as the primary roadblock to scaling data and analytics solutions, directly linking reliability issues to slower execution and weaker business outcomes.
System failures add another layer of risk. When pipelines break silently, incorrect or incomplete data can flow downstream into dashboards, models, and automated decisions. Fixing the issue later often requires undoing work across multiple teams, multiplying the cost of a single failure and further eroding trust in analytics.
How observability reduces downtime and investigation effort
Data observability changes how teams respond to incidents. Instead of discovering problems through broken dashboards or stakeholder complaints, teams get early signals that something is off. Freshness delays, volume drops, or schema changes act as warnings before the issue spreads.
Lineage and metadata provide critical context during investigations. Teams can trace where a problem started, which assets are affected, and who needs to be notified. This reduces guesswork and shortens investigation cycles, allowing data engineers to focus on resolution rather than diagnosis.
Proactive detection vs reactive correction outcomes
Teams operating reactively often learn about issues too late. By the time a problem is reported, trust is already damaged, and downstream work is blocked. Proactive monitoring changes that dynamic. Issues are detected earlier, impact is contained, and communication becomes clearer.
Over time, this shift builds confidence. Business users trust dashboards again, analysts spend less time validating numbers, and data teams move from firefighting to prevention. The result is not just fewer incidents, but a healthier relationship between data producers and data consumers.
|
Case study: Managing data consistency is especially challenging in media and entertainment, where data spans multiple platforms, regions, and consumer touchpoints. In one case, a leading entertainment group used OvalEdge to centralize metadata and align business definitions, reducing inconsistencies and restoring confidence in analytics. |
How modern data teams evolve from quality checks to observability
As data systems grow more complex, traditional data quality checks alone are no longer enough to maintain trust at scale. This is why many teams move from relying solely on data quality checks to adopting data observability as a core capability.
From data at rest to data in motion
Traditional data quality approaches were designed for data at rest. Checks ran on scheduled batches, and issues were addressed after data landed in warehouses. Modern analytics, streaming data, and AI-driven use cases operate on data in motion, where delays or anomalies need to be detected as they happen.
Observability supports this shift by continuously monitoring data as it flows through pipelines. Instead of waiting for reports to break, teams gain visibility into freshness, volume, and behavior changes in near real time.
From known unknowns to unknown unknowns
Early data programs focus on expected failure modes. Teams define rules for nulls, ranges, and formats based on what they know can go wrong. As systems scale, new sources, transformations, and consumers introduce behaviors no one anticipated.
Observability helps teams manage this complexity by learning normal patterns and flagging unexpected deviations. This makes it possible to detect issues that were never explicitly defined.
Building reliable data systems at scale
Reliability is a system property, not the result of a single tool. Data quality enforces business correctness, while observability provides system-level awareness.
Together, they support shared ownership across data engineering, analytics, and governance teams. This combination allows trust in data to scale alongside growing complexity.
The evolution towards reliable data is not just technical. It reflects a change in mindset from fixing issues after the fact to designing systems for trust. OvalEdge’s Data Chaos to Data Trust whitepaper explores this journey, showing how teams move from isolated quality checks to observable, governed data platforms.
Conclusion
The difference between data quality and data observability matters more than ever as data systems grow in scale and complexity. Data quality ensures correctness by validating accuracy, completeness, and alignment with business rules.
Data observability ensures reliability by monitoring how data behaves as it moves through pipelines and surfaces issues early, even when they are unexpected. Relying on only one approach creates gaps. Quality checks without observability often lead to late discovery and reactive cleanup.
Observability without quality lacks the business context needed to explain whether data is actually wrong. When combined, they form a practical reliability framework that improves trust, reduces downtime, and shortens investigation cycles.
As organizations shift toward real-time analytics and automated decision-making, trust becomes a system-level outcome, not a manual process.
Platforms like OvalEdge help bring data quality, observability, metadata, and lineage together so teams can operate with clarity and confidence at scale.
If improving data trust is a priority, now is the time to act.

 Book a demo with OvalEdge and see how you can move from reactive data issues to proactive, reliable analytics.
FAQs
1. Is data observability a replacement for data monitoring tools?
No. Data observability extends beyond basic monitoring by analyzing patterns, metadata, and lineage across data systems. Monitoring tracks known metrics, while observability helps teams understand why unexpected data issues occur and how they propagate.
2. Can data observability work without predefined data quality rules?
Yes. Data observability detects anomalies by learning normal data behavior over time rather than relying on predefined rules, which makes it effective for identifying unexpected issues in dynamic pipelines and rapidly changing data environments.
3. How do data observability tools reduce alert fatigue?
Observability tools prioritize alerts based on impact, patterns, and downstream dependencies, which helps teams focus on meaningful incidents instead of responding to excessive rule-based alerts that often lack context or urgency.
4. Does data observability require access to full datasets?
No. Most data observability platforms rely on metadata, statistics, and sampling rather than full table scans, which allows continuous monitoring at scale without significantly increasing compute costs or affecting pipeline performance.
5. How does data observability support analytics and business teams?
By identifying data issues earlier and providing lineage-based context, data observability reduces broken dashboards, increases trust in reports, and shortens the time analysts spend validating data before using it for decision-making.
6. What is the first step to adopting data observability in an existing stack?
Start by mapping critical data pipelines and downstream consumers, then layer observability on high-impact workflows to gain visibility and reduce incidents before expanding coverage across the broader data ecosystem.
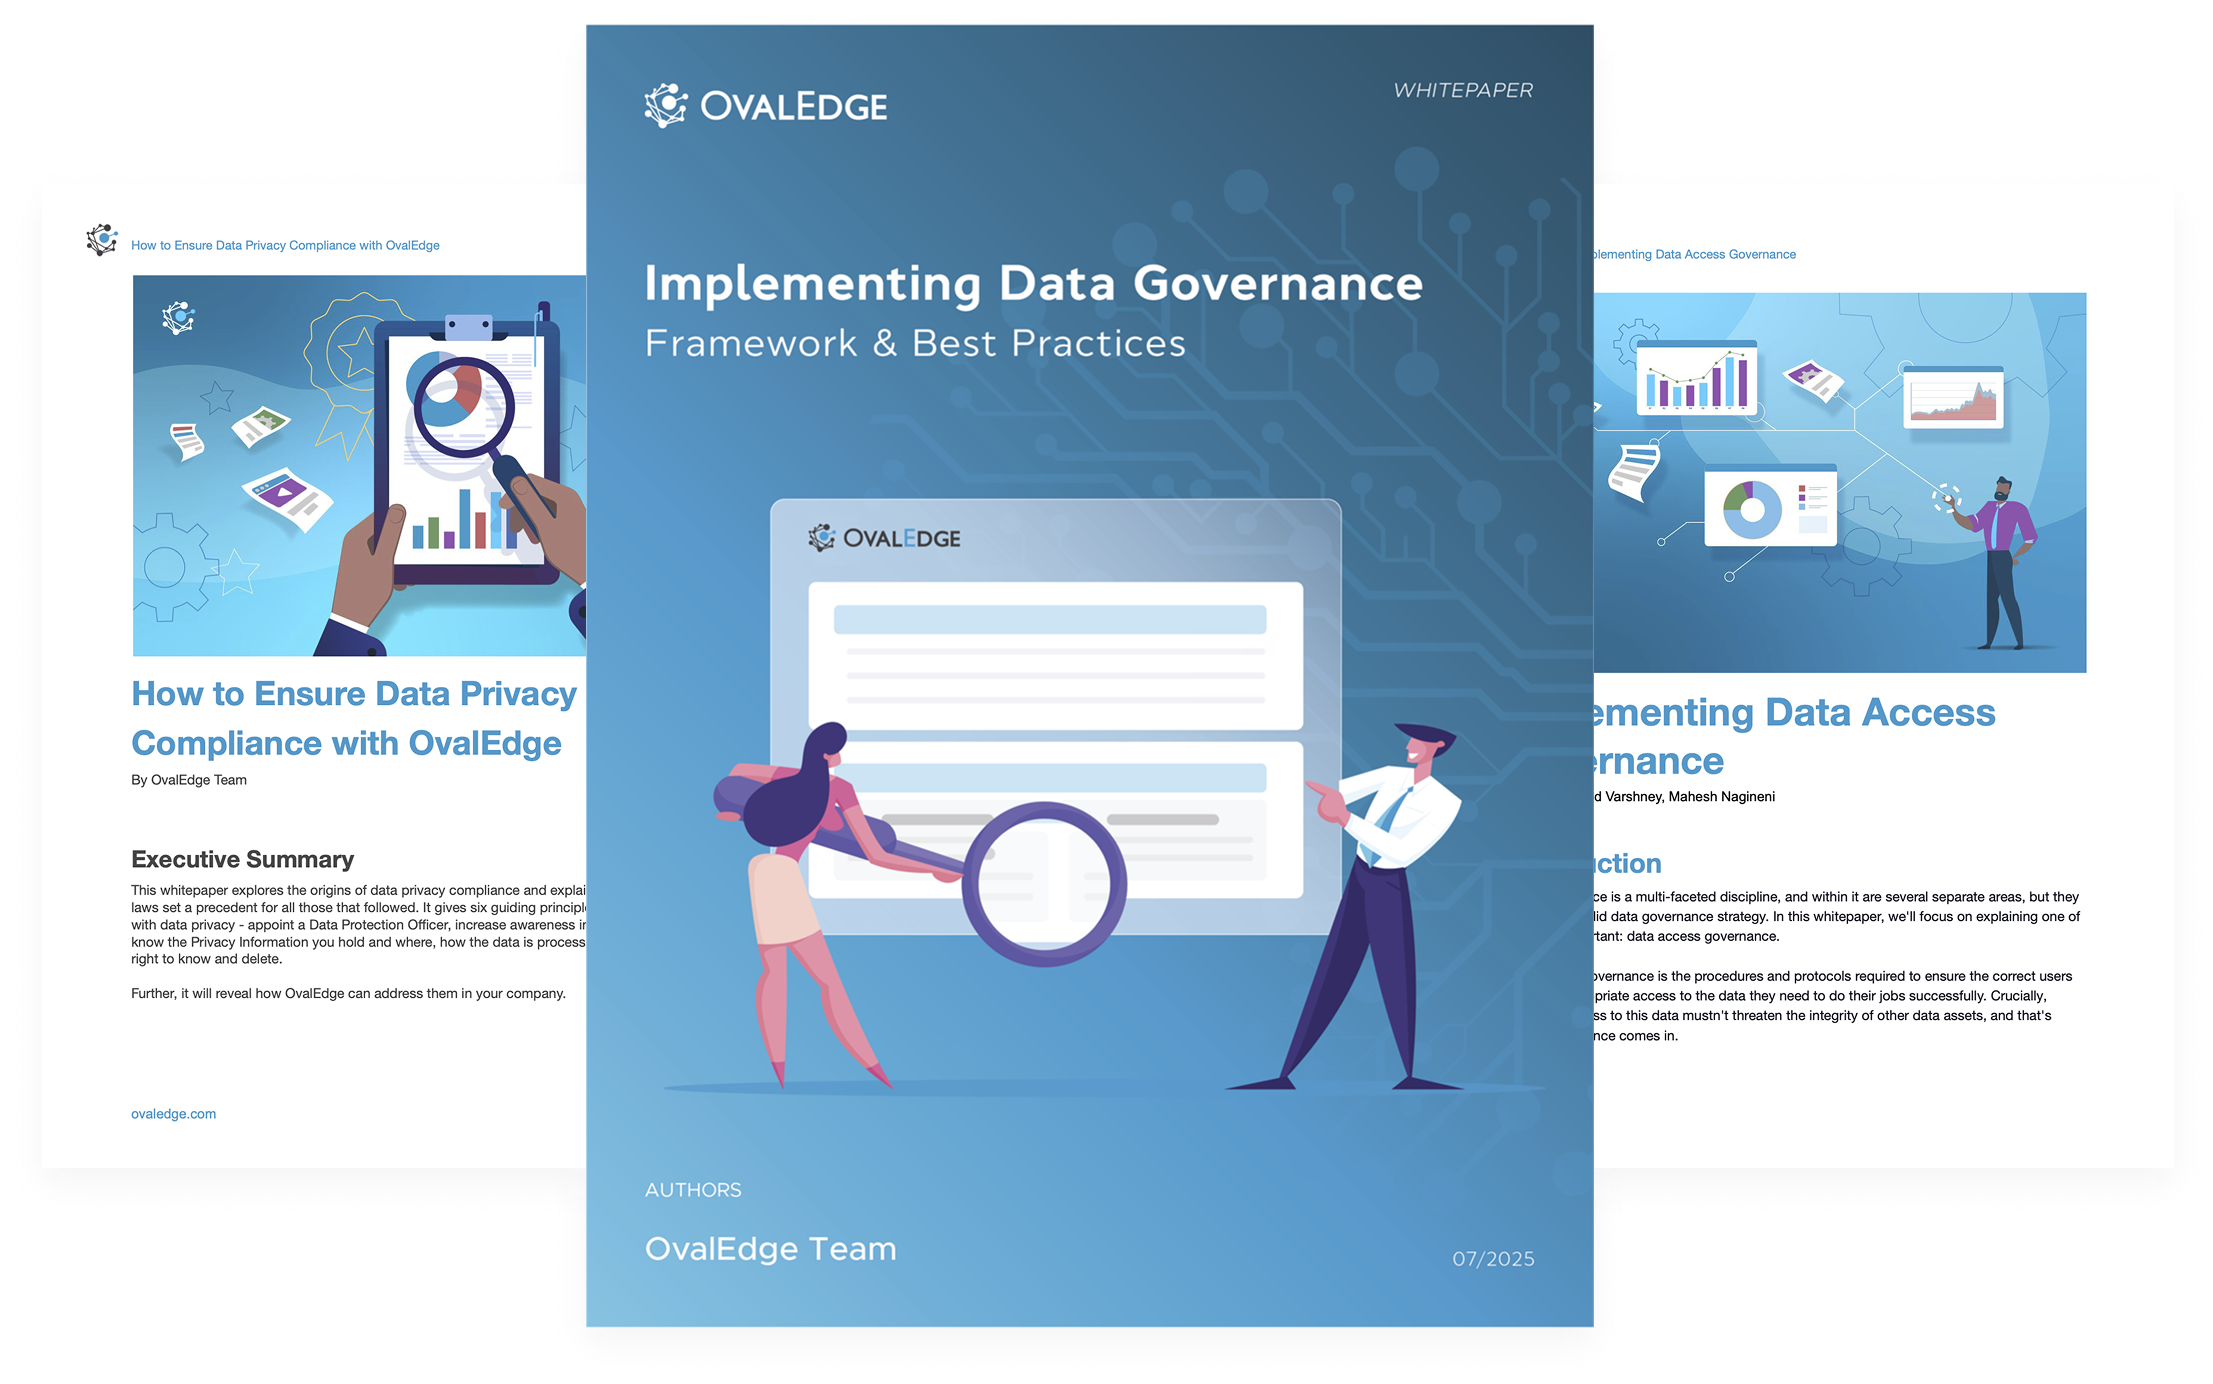
Deep-dive whitepapers on modern data governance and agentic analytics
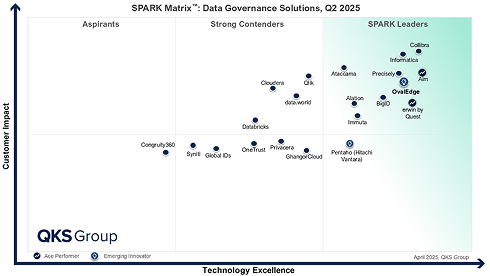
OvalEdge Recognized as a Leader in Data Governance Solutions
3ff1.png)
“Reference customers have repeatedly mentioned the great customer service they receive along with the support for their custom requirements, facilitating time to value. OvalEdge fits well with organizations prioritizing business user empowerment within their data governance strategy.”
aef2.png)
“Reference customers have repeatedly mentioned the great customer service they receive along with the support for their custom requirements, facilitating time to value. OvalEdge fits well with organizations prioritizing business user empowerment within their data governance strategy.”
Gartner, Magic Quadrant for Data and Analytics Governance Platforms, January 2025
Gartner does not endorse any vendor, product or service depicted in its research publications, and does not advise technology users to select only those vendors with the highest ratings or other designation. Gartner research publications consist of the opinions of Gartner’s research organization and should not be construed as statements of fact. Gartner disclaims all warranties, expressed or implied, with respect to this research, including any warranties of merchantability or fitness for a particular purpose.
GARTNER and MAGIC QUADRANT are registered trademarks of Gartner, Inc. and/or its affiliates in the U.S. and internationally and are used herein with permission. All rights reserved.